

Coronado October Market Snapshot
| Metric | Village | Cays | Shores |
|---|---|---|---|
| Closed sales | 14 | 2 | 1 |
| Average sale price | $3,069,046 | $3,847,500 | $1,595,000 |
| Average price/sq. ft. | $1,508 | $1,199 | $1,967 |
| Average DOM | 32.9 | 73 | 3 |
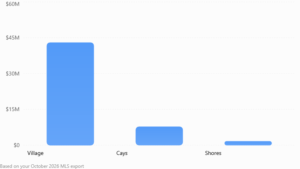
| Total sales volume | $42,966,645 | $7,695,000 | $1,595,000 |
These figures reconcile exactly to your MLS report’s 17 sales and $52,256,645 total volume. Average price per square foot is calculated as the arithmetic mean of the individual transactions’ sale price per square foot.
October closed-sales volume by neighborhood
Coronado Cays Real Estate Market Update: October 2026
Waterfront Demand Remains Active, but Marketing Times Vary
The Coronado Cays recorded two residential sales during October 2026, generating $7.695 million in total sales volume.
Both transactions involved detached waterfront residences, with sale prices exceeding $3.5 million.
The average sale price was approximately $3.85 million, while average price per square foot reached $1,199.
October 2026 Market Snapshot
| Metric | October 2026 |
|---|---|
| Closed Sales | 2 |
| Average Sale Price | $3,847,500 |
| Average Price Per Sq. Ft. | $1,199 |
| Average Days on Market | 73 |
| Total Sales Volume | $7,695,000 |
October Coronado Cays Home Sales
| Property | Sale Price | Days on Market |
|---|---|---|
| 6 Green Turtle Road | $4,100,000 | 144 |
| 48 Spinnaker Way | $3,595,000 | 2 |
The difference in marketing time between these two properties is particularly noteworthy.
48 Spinnaker Way sold after just two reported days on market, while 6 Green Turtle Road recorded 144 days.
That wide variation demonstrates how differently individual waterfront properties can perform.
October vs. September
Compared with September:
- Closed sales: Unchanged at two.
- Average sale price: Increased approximately 3%.
- Average price per square foot: Increased approximately 20%.
- Total sales volume: Increased approximately 3%.
With just two transactions, these changes should not be interpreted as broad neighborhood appreciation.
The properties sold in each month had different characteristics, and those differences significantly influence the averages.
What Does 73 Days on Market Really Mean?
October’s average of 73 days is mathematically correct, but it illustrates the limitations of small-sample market statistics.
One property recorded only two days on market, while the other recorded 144.
Neither transaction individually reflects the neighborhood average.
For homeowners, this highlights the importance of evaluating comparable properties based on their specific waterfront characteristics rather than assuming all Coronado Cays homes follow the same market conditions.
What October Means for Coronado Cays Homeowners
The Cays remains a specialized waterfront market.
Private dock access, channel orientation, boat accommodation, waterfront frontage, home condition, and location within the community can create substantial differences in buyer demand.
October’s two transactions demonstrate that buyers remain active in the multimillion-dollar waterfront segment, but successful pricing requires a property-specific strategy.
The takeaway: Coronado Cays waterfront properties continue to attract buyers, but location, condition, and pricing can dramatically influence marketing time.
Source: October 2026 SDMLS closed-sales report. September comparisons use the previously compiled September dataset.
Get your free Home Valuation using my tool at: Home Valuation Report
Matt Smith, Broker, MBA
Owen Properties
c: 619-436-4550
matt@coronadomatt.com
DRE Lic. #01796182